My first line of communication is our school newsletter. In our school newsletter, I share announcements about upcoming library events, research projects that involve the library, digital literacy articles from the internet and pictures of our students participating in library events & research. Our school newsletter creator is awesome and always saves a spot for my library news. I usually post the same information for the school newsletter to the announcement page on our school library website. The school library website has been a great tool for sharing pictures, videos and library news. I can easily update the home page with whatever information I want to feature at that time.
I send my principal and assistant principals quarterly reports sharing what we've been up to in the library. I also send them an annual report. I follow a basic format for all of my reports: program highlights, library statistics and information about collaborative projects. If time permits, I include pictures and videos to help illustrate the data. I also make the reports available on our school library website. I share the link with parents in our school newsletter and the library website announcement page each time I add a new report.
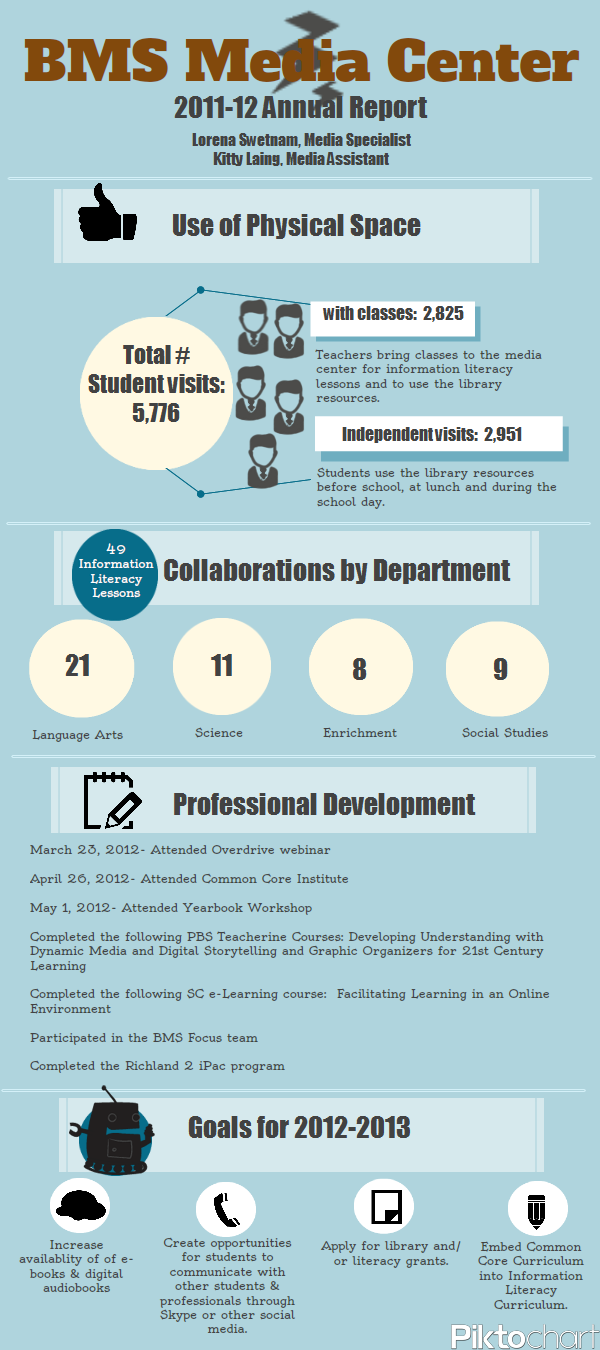
In the past, I created a document with lots of information for my annual report. This year I wanted to create an infographic after media specialist Fran Bullington shared how to do this on her blog Informania. I tried Piktochart and it was pretty easy to figure out. Thanks for sharing this great idea, Fran!!
Here is my annual report for 2012-2013 that I created using Piktochart:
I also help post information to our school Facebook, Twitter and Youtube accounts. I like to post lots of "reading is important" type posts on these accounts, along with the usual school announcements.
I think sharing what we do in the library is important. It does not take much time for me to put together a report because I keep track of everything on my calendars. I pull library stats from the library circulation system. I keep pictures filed by month. I just have to make the commitment to sit down once a quarter for 30-45 minutes to put it all together and send it out to my various outlets.
Everyone in my school is supportive of our library program, but I still want to advocate for myself and what starts in the library.
How do you get the word out about what happens in your library?

Love your infographic! Thank you for sharing how you promote your program. Great ideas, as always!
ReplyDeleteThanks, Fran!
DeleteLorena, I just added this post to the USC-SLIS SLM Impact wiki http://slmimpact.wikispaces.com/Tools - it is a great example of an infographic. Thanks so much for the other ideas as well!
DeleteGerry, Thank you for including this post in the USC SLIS SLM Impact wiki. I'm honored. I've bookmarked the wiki for myself as it has a lot of great information.
ReplyDeleteLorena, Thanks for sharing your thoughts. I just realized that I just met you on Friday. Already "stealing" this report idea.
ReplyDelete